

At Joomlatools our developers use different code editors based on their own preferences, Jebb, one of our rockstar Filipino devs uses Sublime Text editor and wrote a little tutorial on how to use xdebug with it.
Check out our previous article about Debugging Joomla with PhpStorm and Xdebug to see how powerful xdebug can be and what it could mean for your development process or for further explaination of terms.
Requirements
Once you have installed and configured both Sublime Text and Joomlatools Vagrant Box, ensure that xdebug is enabled on the vagrant box:
box xdebug:enable
Then, create a new site for demonstration purposes:
joomla site:create debug
Configuring Sublime Text to work with xdebug
First, let's create a new project from the debug site we created previously:
Open up a new Sublime Text window
From Sublime Text's toolbar select
Project > Save Project Asand save the file asdebug.sublime-projectMake sure that you have installed Sublime Text's package control.
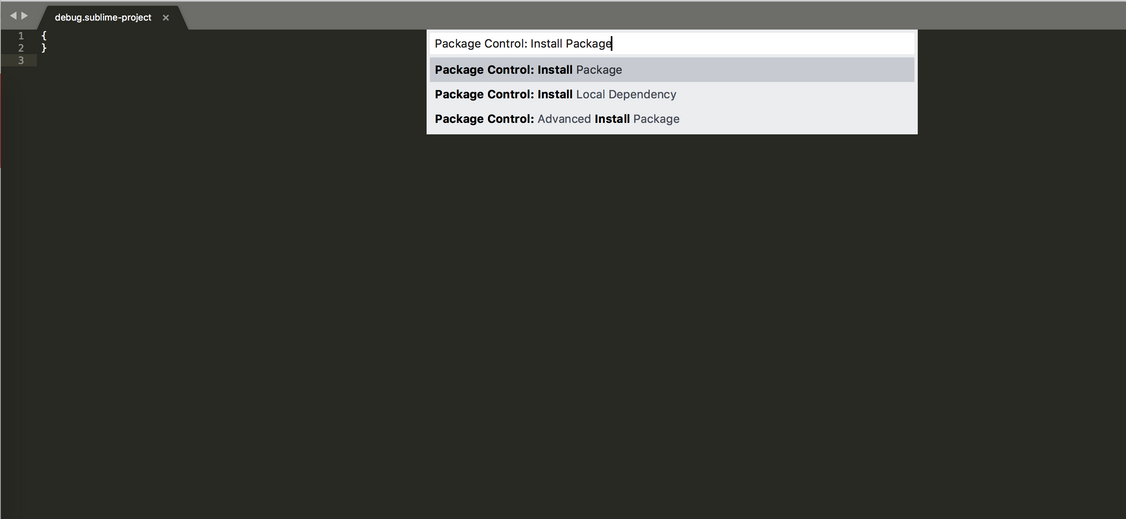
Next, go to
Tools > Command Paletteand search forPackage Control: Install Package.

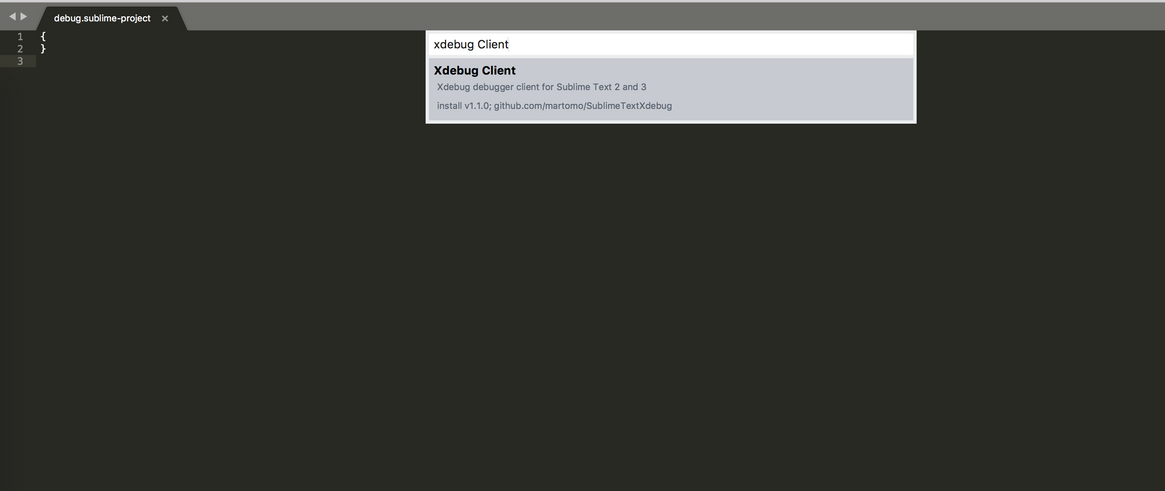
- Then you can search for the
Xdebug Client:

- Finally, let's edit the
debug.sublime-projectfile we created earlier:
{
    "folders":
    [
        {
            "follow_symlinks": true,
            "path": "."
        }
    ],
    "settings":
    {
        "xdebug":
        {
            "close_on_stop": true,
            "path_mapping":
            {
                "/var/www/debug/": "/Users/joomlatools/Sites/joomlatools-vagrant/www/debug/"
            },
            "super_globals": true,
            "url": "http://debug.test"
        }
    }
}
N.B. A quick note on path mappings. These enable Sublime Text to know how the server paths relate to your local setup and should be provided in the format:
"vagrant/box/path" : "host/machine/path"
You should amend "host/machine/path" to indicate where the debug files are located locally.
Ready, get-set, go!
OK then, now that we have configured everthing, let's start our first debugging session.
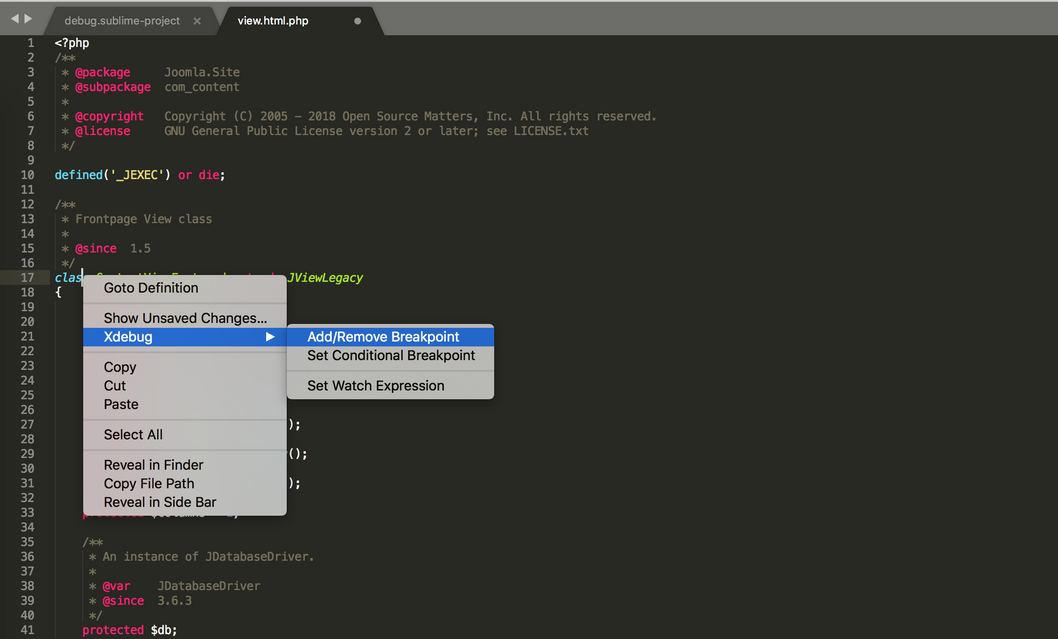
- Open up the following file
debug/components/com_content/views/featured/view.html.php - From Sublime Text's toolbar go to
Tools > Xdebug > Start Debugging (Launch Window) - Right click on line Ln 17 and from the context menu select
Xdebug > Add/Remove Breakpoint:

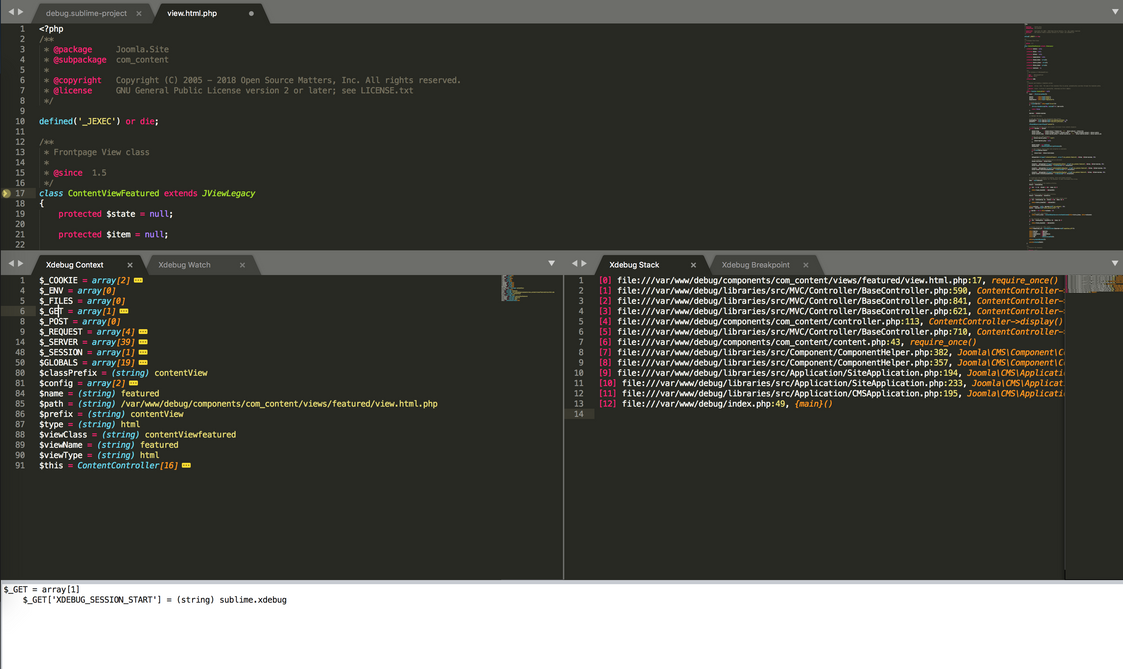
Return to the browser and refresh the page
Return to Sublime Text to see the new output:

Note if you don't get the start debugging (launch browser) something is probably wrong with your debug.sublime.project file. Delete the file and start again, ensuring that the path on the vagrant box and the path on your host machine both exist.
Happy coding!
Be the first to know about upcoming extensions, features, and news by following us on Twitter or Facebook and Linkedin.