
Sometimes these are easily spotted by just using a var_dump, print_r and/or die statement. I still use those sometimes, no shame on that. However, when code gets complex you need to have the right companion at your side. My companion is called PhpStorm.
PhpStorm is not a debugger. It is a nicely designed PHP Integrated Development Environment (IDE) with lots of goodies that will make your life as a developer much easier such as:
- Version control
- Debugging
- Deployment
- Vagrant
- Composer
- REST client
Environment setup
Our Joomlatools Vagrant box comes with Xdebug installed and configured out of the box. Make sure to enable Xdebug after installing the box:
box xdebug:enable
Joomla site
We will install a Joomla site for debugging. Execute the command below from your box:
joomla site:create debug
The newly installed Joomla site can be reached at http://joomla.box/debug.
Source code
Next we need real code to debug. A good candidate for this task is our 'Hello World' component.
Clone the component repository in the Projects folder located in the directory where you started the box from:
git clone https://github.com/joomlatools/joomla-com_helloworld
The Projects folder is a shared folder. This means that the same source code is available on both your local filesystem and the one located in the Vagrant box.
We will now symlink and install the 'Hello World' component in the Joomla site you have previously created. Execute the following commands from inside your box:
joomla extension:symlink debug joomla-com_helloworld
joomla extension:install debug helloworld
PhpStorm project
For working or even debugging code in our development environment we need to create a project in PhpStorm.
Open PhpStorm and create a new empty project by selecting the Projects directory. PhpStorm will prompt a message letting you know that the folder already contains some source code. Click Yes to continue.
You now have access to all of the files and folders available in the 'Hello World' component.
External libraries
Having access and debugging the Joomla site source code is also very useful. For this we need to add the entire site as an external library:
- Right click on
External Librariesunder the file explorer. - Click on
Configure PHP include Paths. This will open a new dialog for introducing paths of libraries being used in your project. - Click on the plus sign (+) and add the
www/debugdirectory located in the box install directory. - Click on
OKto save and quit.
www is another shared directory that gets automatically created when you install the box. It exposes the source code of our Joomla debug site and can be browsed using the file explorer.

Path mappings
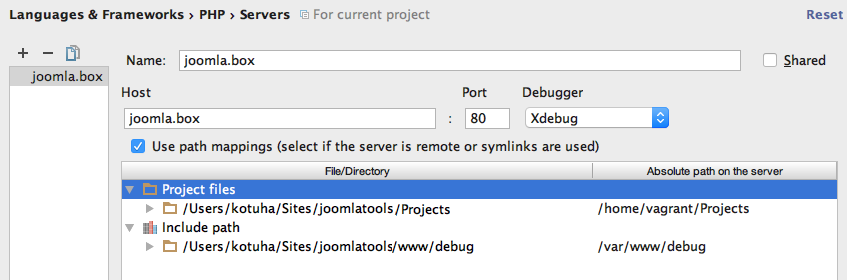
We also need to tell PhpStorm about path mappings. These are used by PhpStorm to map local project files to those located in our remote server.
- Open the
Preferenceswindow under the PhpStorm menu. - Click on
Language & Frameworks=>PHP=>Servers. - Click on the plus sign (+) to define a new configuration. The name and host should point to
joomla.box. - Active the
Use path mappingscheckbox. - Set the following mappings:
/path/to/your/Projects=>/home/vagrant/Projects/path/to/your/www=>/var/www/debug
- Click on
OKto save and quit.
Additionally, and still while on the PHP settings, go to the Debug configuration area and make sure to disable the option Force break at the first line when no path mapping is specified under the Xdebug section. This will avoid unwanted breaks due to absent path mapping from system requests such as those from Z-ray.
At this stage our development environment is set. We are now ready for debugging real code!
Debugging
To start a debug session in PhpStorm you need to click on the little bug phoning home icon ![]()
![]() located in the toolbar. Make sure the little bug is green
located in the toolbar. Make sure the little bug is green ![]()
![]() which means that PhpStorm will listen for incoming debugging connections.
which means that PhpStorm will listen for incoming debugging connections.
With PhpStorm properly configured for debugging we now need to add one or more breakpoints somewhere in the code. To add a breakpoint open the administrator/components/com_helloworld/helloworld.php file using the PhpStorm file explorer and make a click on the grey column at the left of the echo 'Hello World!'; statement:
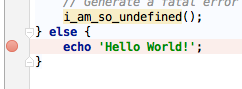
The red circle means that you’ve added a breakpoint. PhpStorm will stop the script execution at that particular line.
Start an Xdebug session
Open the following URL in your browser with username & password: admin:
http://joomla.box/debug/administrator/index.php?option=com_helloworld&XDEBUG_SESSION_START=PHPSTORM
PhpStorm will now gain control of the execution of the script and the debug panel will pop-up.
The XDEBUG_SESSION_START variable in the previous URL tells Xdebug that we are initiating a debug session. An even more convenient way if you use Chrome is to install the Xdebug helper to initiating the debug and profiling sessions with a single click.
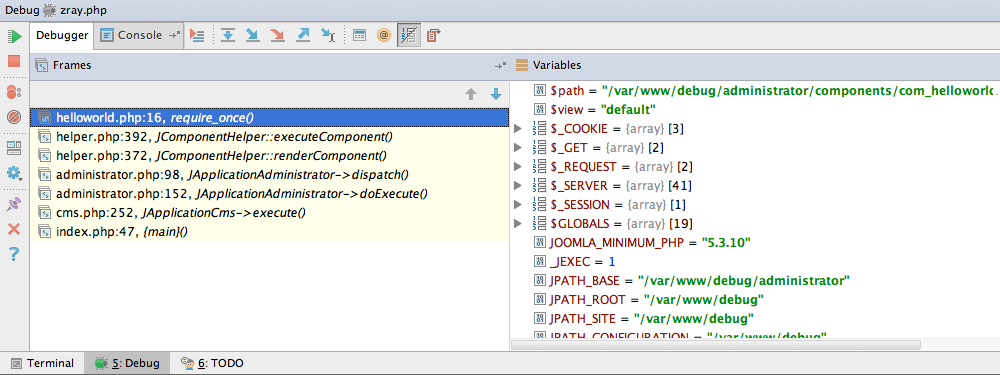
Debugger panel
The debugger panel shows a call stack as well as a list of context variables in the left and right columns respectively. You can even watch some variables by just dragging them from the Variables to the Watches container.
The panel's toolbar has common debugging action buttons such as Step Over (step to the next line in the current file) and Step Into (Step to the next executed line).
One of my favorites is the Evaluate Expression feature. You can access this tool by clicking on its toolbar button ![]()
![]() . You'll get a new dialog for evaluating expressions in the current context. You can also watch an evaluated expression by using
. You'll get a new dialog for evaluating expressions in the current context. You can also watch an evaluated expression by using Ctrl+Shift+Enter from within this window.
Another useful feature is the possibility of adding conditional breakpoints. You just make a breakpoint conditional by right clicking on it and adding a condition such as $result === false. In this scenario PhpStorm will only stop execution if the condition is met.
Debug the right way
Developers should concentrate on what they do best which is writing awesome code. For writing great software you need to have the right tools at your disposal.
PhpStorm provides a straightforward interface for debugging code. It also provides a clean and top notch code editor with lots of features. Its integrated debugging interface also makes for an excellent testing and learning tool. Being able to execute code step by step with complete awareness of the context (variables, call stack, etc.) is golden.
Debuggers exist and you should use them. Once you have tried it, there is no coming back. That is also a fact!
Happy coding!